Adolescents & Young AdultsMethods & Data
What the Young-Adult Loneliness Numbers Cannot Tell Policymakers
Surveys converge on a striking figure -- young adults report more loneliness than any other age group -- but the instruments behind that figure are not built to say why, or what would change it.
Center for Social Connection
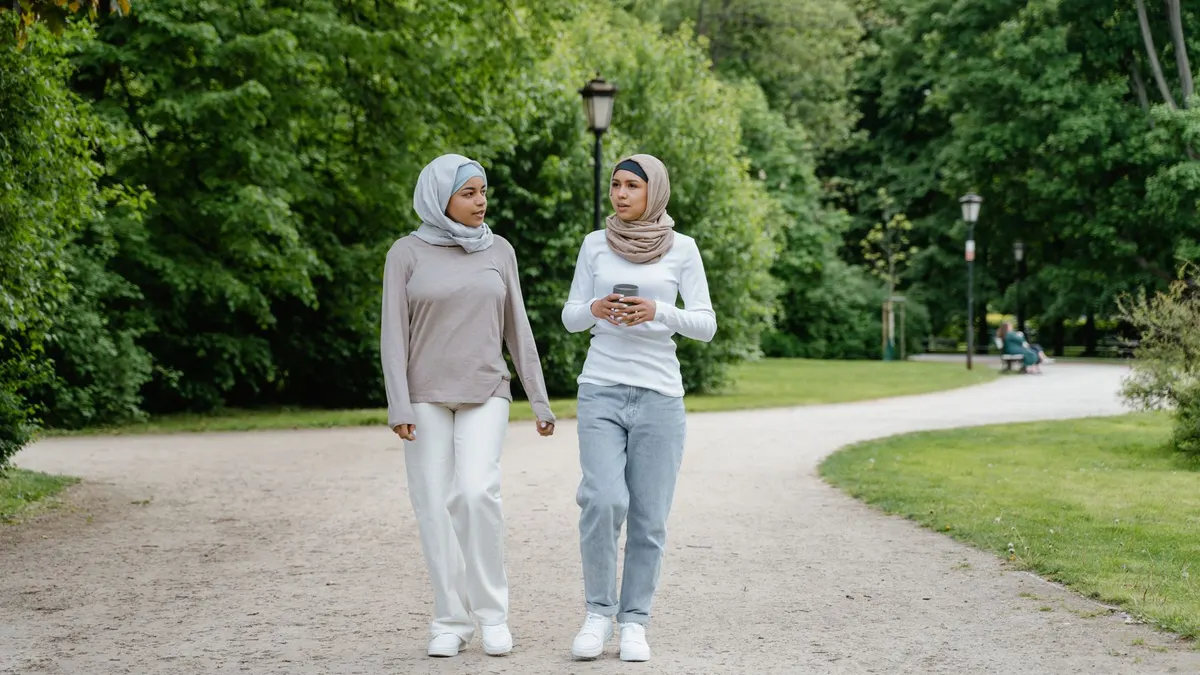
Every recent survey that breaks loneliness down by age finds the same pattern: young adults report more of it than any other group. Gallup’s 142-country survey put loneliness among 19- to 29-year-olds at 27%, against 17% for adults 65 and older. Harvard’s Making Caring Common project found 61% of 18- to 25-year-olds reporting serious loneliness in 2021, against 36% of Americans overall. The eight-country study led with Washington University in St. Louis found nearly half of young adults reporting loneliness. Cigna’s 2025 report found Gen Z and Millennials lonelier than Gen X and Baby Boomers, despite reporting more technological connectedness by every measure the survey asked about.
The pattern is consistent enough across instruments, countries, and years that it is not, at this point, seriously contested. What is contested – or rather, what is simply unaddressed – is why. And the reason it is unaddressed is not that researchers have failed to ask. It is that the survey instrument that produces the finding is not built to answer the question that follows it.
What a loneliness scale measures
The UCLA Loneliness Scale, the most widely used instrument in this literature, asks respondents to rate agreement with statements like “I feel left out” or “I feel isolated from others.” It is a well-validated measure of a subjective state. It was never designed to identify the structural conditions that produced that state, and it cannot distinguish between a 22-year-old who is lonely because she moved to a new city for a job and lost her college friend network, and a 22-year-old who is lonely because he spends six hours a day on a phone and has never learned to make a plan with someone he’d like to see again. Both score identically on the scale. Policy responses to the two cases would look nothing alike.
This is not a minor caveat. It is the central limitation of using loneliness prevalence figures as a policy input at all. A number like 61% or 27% tells a health system how many people are experiencing a state associated with elevated cardiovascular and mortality risk. It does not tell a health system, a university, or a city government what to build, fund, or change. The BMC Public Health review of the state of loneliness research in 2023 made a version of this point directly, flagging inconsistent measurement across the field as a structural barrier to comparing findings – and comparison problems compound when the underlying question is not “how lonely” but “lonely because of what.”
The isolation-loneliness split, and why it matters more for young adults than for anyone else
Social isolation is a structural property of a network: how many people someone sees, how often, how diverse those ties are. Loneliness is the subjective gap between the connection someone wants and the connection they have. The two are correlated but not interchangeable, and a 2024 study in Scientific Reports focused specifically on how the relationship between isolation and loneliness varies by age found that the two constructs decouple differently across the life course.
For older adults, isolation is frequently the driver: someone loses a spouse, stops driving, and their network shrinks in ways that are visible and structural. For young adults, the picture is messier. Many report objectively large networks – hundreds of social media contacts, roommates, classmates, coworkers – while still scoring high on loneliness measures. That gap is exactly what a loneliness scale cannot resolve, because it asks about the feeling and not about the network that produced it.
Two recent studies push at this from different directions without fully closing it. A 2026 nationally representative study on closeness of social media contacts and loneliness examined whether the quality of online ties, rather than their number, moderates the loneliness relationship. A separate 2026 Oregon State University study of adults aged 30 to 70 found that connecting with strangers online was linked to greater loneliness, while connecting online with people already known was not linked to greater loneliness – but also was not linked to less. Read together, these findings suggest that raw network size, the thing survey instruments most easily count, is close to irrelevant, and that something about tie quality or reciprocity is doing the real work. Neither study, though, was designed to isolate what that something is, and neither covers the 18-25 population where loneliness runs highest.
What the friendship-decline data can and cannot support
The American Enterprise Institute’s 2021 survey of American friendship found that 12% of Americans report having no close friends, up from 3% in 1990, and that the share of men with six or more close friends fell from 55% to 27% over the same period. This is frequently cited alongside youth loneliness figures as though it explains them: fewer friends, more loneliness, causal story complete.
The survey does not support that inference on its own terms. It is a single cross-sectional comparison against a 1990 baseline, not a panel that follows the same people over time, and it measures friendship counts, not the mechanisms behind their decline – geographic mobility, work hours, the shift of informal socializing away from third places, digital substitution, or something else entirely. It is entirely possible that declining friend counts and rising loneliness share a common cause – the same restructuring of daily life – without either causing the other. The survey cannot distinguish these possibilities, and treating a correlation between two trend lines as a causal chain is a move the underlying data does not license.
The HINTS-6 finding and the publication-date problem
The American Journal of Preventive Medicine’s 2025 analysis of HINTS-6 data found that roughly 1 in 7 U.S. adults reported severe loneliness and over 37% reported moderate-to-severe loneliness. The data underlying that figure were collected in 2022. A reader encountering the 2025 publication date might reasonably treat the finding as current; it describes conditions three years earlier, during a period when pandemic-era disruptions to routine and socializing were still resolving. This is not a flaw specific to HINTS-6 – it is endemic to the field, since national survey infrastructure takes time to field, clean, and publish – but it means that stacking figures from different publication years to build a trend line is a mistake unless the underlying fieldwork dates are checked first.
What a study designed to answer the policy question would look like
The instruments that produce prevalence figures are not badly designed; they do what they were built to do, which is estimate how many people are experiencing a subjective state, comparably across time and place. The problem is applying them to a question they were not built to answer: what specifically, for an 18- to 25-year-old, would reduce that state.
A study built for that purpose would need to be longitudinal rather than cross-sectional, following the same young adults through transitions – leaving school, changing cities, starting first jobs – where network structure changes sharply, and measuring loneliness alongside network composition at each point rather than as a single snapshot. It would need to separate the effect of network size from network quality, something the 2026 social-media-closeness studies gesture toward but do not resolve for this age group specifically. And it would need a comparison group exposed to some structural intervention – a workplace, campus, or civic programme that changes the opportunity structure for contact, not just messaging about loneliness awareness – against a matched group that is not.
Almost nothing in the current literature fits that description for young adults specifically. The randomised trials that exist – HEAL-HOA’s volunteering trial, the behavioral-activation trial, the aged-care befriending trial – are all built around adults over 65, because that is where the health system stake was recognized first, through routes like the National Academies’ 2020 consensus report. Until a comparable trial architecture exists for the 18-25 population, prevalence figures will keep confirming that young adults are the loneliest age group without ever specifying what a government, university, or employer should change in response. That is a gap in the evidence, not a reason to stop measuring – but it is a reason to stop treating the measuring as though it were the answer.
Sources
- Loneliness in America: How the Pandemic Has Deepened an Epidemic of Loneliness
- Almost a Quarter of the World Feels Lonely
- Loneliness in America 2025
- Loneliness, Depression and Generalized Anxiety Across Eight Countries
- Prevalence of Loneliness States Among the U.S. Adult Population: Findings From the 2022 HINTS-6
- The State of American Friendship: Change, Challenges, and Loss
- The State of Loneliness and Social Isolation Research: Current Knowledge and Future Directions
- New Directions in the Investigation of Loneliness and Social Connection Across Time Scales and Contexts
- Understanding the Interplay Between Social Isolation, Age, and Loneliness During the COVID-19 Pandemic
- Closeness of Social Media Contacts and Loneliness Among US Adults: A Nationally Representative Study
- At Best, Social Media Connections Unlikely to Make You Less Lonely